The Sysadmin's Toolbox: iftop

Who's using up all the bandwidth, and what are they doing? Use iftop to find out.
Longtime system administrators often take tools for granted that they've used for years and assume everyone else has heard of them. Of course, new sysadmins join the field every day, and even seasoned sysadmins don't all use the same tools. With that in mind, I decided to write a few columns where I highlight some common-but-easy-to-overlook tools that make life as a sysadmin (and really, any Linux user) easier. My last article covered sar, a tool you can use to collect and view system metrics over time. This time, I discuss a program that's handy for viewing real-time network performance data: iftop.
Anyone who's had to use a network at a conference has experienced what happens when there just isn't enough network bandwidth to go around. While you are trying to check your e-mail, other people are streaming movies and TV shows, downloading distribution install disks, using p2p networks, upgrading their distributions or watching cat videos on YouTube. Although it's certainly frustrating to try to use one of those networks, imagine how frustrating it would be to be the admin in charge of that network. Whether you run a conference network, a local office network or even a Web server at your house, it can be really nice to know what is using up all of your bandwidth.
iftop is a Linux command-line program designed to give you live statistics about what network connections use the most bandwidth in a nice graphical form. As you may realize from the name, iftop borrows a lot of ideas from the always-useful load troubleshooting tool top. Like top, iftop updates automatically every few seconds, and like top, by default, it sorts the output you see by what's using the most resources. Where top is concerned with processes and how much CPU and RAM they use, iftop is concerned with network connections and how much upload and download bandwidth they use.
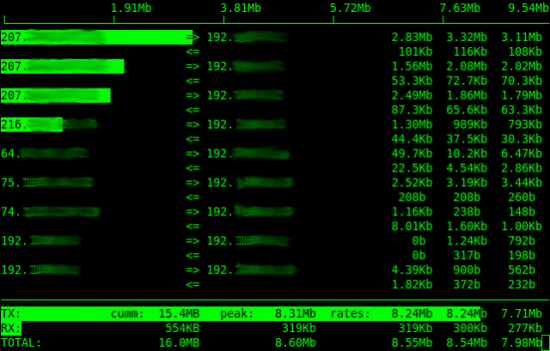
Even though iftop is packaged for both Red Hat- and Debian-based distributions, it's probably not installed by default, so you will need to install the package of the same name. In the case of Red Hat-based distributions, you might have to pull it down from a third-party repository. Once it's installed, the simplest way to get started is just to run iftop as the root user. iftop will locate the first interface it can use and start listening in on the traffic and display output similar to what you see in Figure 1. To close the program, press q to quit just like with top.

Figure 1. iftop output—the IPs have been smudged to protect the innocent.
At the very top of the screen is a scale that goes along with the bar graph iftop might display with each connection. The next rows of output correspond to each network connection between a pair of hosts. In between the two hosts are arrows that let you know the direction the traffic is flowing. The final three columns provide average bandwidth for each connection during the last 2, 10 and 40 seconds, respectively. So for instance, the very top connection in Figure 1 has averaged around 2.83Mb during the last 2 seconds, 3.32Mb during the last 10 seconds and 3.11Mb during the last 40 seconds. Underneath all the transmit and receive columns at the bottom of the screen are a series of statistics for overall transmitted and received traffic (TX and RX, respectively) including 2-, 10- and 40-second averages for both those and, finally, the totals for the interface.
Note: if you have a server with multiple interfaces, you may want iftop
to monitor a different interface from the default. Just add
-i followed
by the interface to monitor when you launch iftop. For instance, to
monitor eth2, I would type iftop -i eth2.
Disable DNS Lookups
By default, when you run iftop, it will try to translate all of the
IP addresses into hostnames. Sometimes this can be useful if you are
diagnosing issues on a local network; however, like with a lot of other
network diagnostics tools, resolving all of those IPs can slow down the
program and also may contribute to the traffic you see in the output. The
solution is to run iftop with the -n argument, so it just shows you IP
addresses for everything (you always can run a DNS query against an IP
you are interested in, in another window). Alternatively, if you already
have iftop running, you can press n to disable DNS lookups.
Show Port Data
When you run iftop on a server that might serve multiple purposes, it can be handy to know whether all of that upstream traffic is accessing your Web server, your mail server or something else. Alternatively, if you are trying to figure out what's using up all of your download bandwidth, it can be handy to see whether the top connections are Web connections or some rsync job you have running. To figure all of this out, iftop allows you to toggle the port display on and off. Press the p key while iftop is running, and it will display the ports used for both the source and destination IP for all traffic.
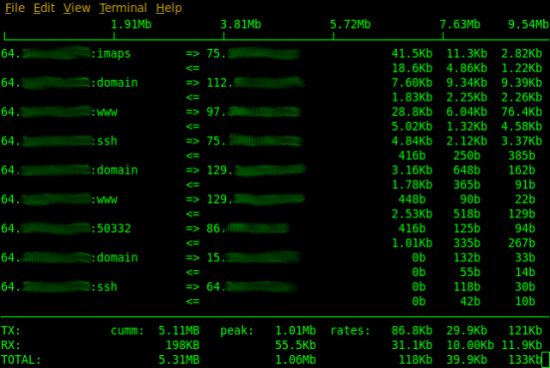
The one big downside to showing both the source and destination ports used for a connection is that you'll find in many cases you are concerned only with one or the other. For instance, if you are running a Web server, you may notice that a lot of traffic is going to your Web port (labeled www in iftop), but all of the ports used by IPs accessing your Web server use all sorts of high ports. In that case, you can press either S or D to toggle the display of either source or destination ports, respectively. Figure 2 shows an example of iftop output where I've chosen to display only the source ports.

Figure 2. iftop with only the source ports displayed.
For me, the really great thing about iftop is that it's a relatively simple command-line tool. It's true that a number of other programs exist that can provide fancy Web-based graphs of your network traffic, and I think those are great for trending network data just like they are for trending system load and other metrics. What I like about iftop is the same thing I like about top—when there's a problem, you can get instant real-time data about your system that updates as the situation progresses.


