Nagging Notifications
In the February 2011 issue, I wrote about screen, the console window manager, and how I configure its hardstatus line to show notifications along the bottom of my terminal window. Although some people like their desktop environment to fire up notifications when they have a new e-mail or IM, because I spend a good deal of my time within screen, it has my focus, and it makes sense to put important notifications there. In that February 2011 article, I introduced how to set up the hardstatus line and demonstrated a custom script I use to show when I have new e-mail.
For this article, I expand on the topic of screen notifications with a new notification script I've found incredibly useful. Ever since I've had more than a handful of servers, I've relied on monitoring programs like Nagios to keep track of server health. Although monitoring software has its own method of notifications via e-mail or SMS, I've found it valuable to have my current Nagios health right there in my screen session. It not only provides a backup to my mail notifications, it also saves me from having a Nagios window open in my browser all the time.
If you are new to screen and haven't set up a custom hardstatus line, check out my February 2011 article first to get up to speed. Instead of revisiting how to configure a .screenrc file from scratch, I'm assuming you already have a basic .screenrc set up, and instead, I'm skipping ahead to how to add this Nagios script to your existing screen session.
Screen Scraping for Screen
When I set about writing this script, I realized there are a number of different ways to capture the current health of Nagios. Although I didn't spend a lot of time looking into it, I imagine there are lower-level APIs I could query, but honestly, all I really wanted was to know if Nagios was all green (okay) or had any warnings or critical alerts (yellow or red), and if so, how many. To accomplish that, I decided the simplest method was to scrape one of the Nagios status pages for the information I needed. Honestly, this same method should work pretty well for just about any monitoring program you might use, as long as it has a Web interface and you have enough regex-fu to parse the HTML for the data you need.
I originally wrote the script so that if the Nagios status was okay, it would print that, and if there were any critical or warning alerts, it would output those statistics instead. I realized that I wanted screen to print okay in green, warnings in yellow and critical alerts in red. That way, I might notice problems even if I wasn't looking directly at my terminal at the time. To accomplish this, I actually needed to run the script three different times within screen.
The script below takes just two arguments: the Nagios host to poll (with an optional user name and password if you use one) and the type of status to report. I chose the color codes green, yellow and red to represent okay, warning and critical statuses, respectively. I found the https://nagioshostname/cgi-bin/nagios3/tac.cgi page was the simplest to scrape and had all of the information I needed for the script:
#!/usr/bin/perl

# usage: nagios_scraper.pl [user:password@]nagios_host STATUS
# where STATUS is green, red, yellow, or all

$nagios_host=shift;
$show=shift;

open TAC, "wget --timeout=2 -q -O -
 ↪https://$nagios_host/cgi-bin/nagios3/tac.cgi |"; @tac = <TAC>;
close TAC;

foreach $line (@tac){
   if   ($line =~ /(\d+) Down/){        $hosts_down = $1; }
   elsif($line =~ /(\d+) Unreachable/){ $hosts_unreachable = $1; }
   elsif($line =~ /(\d+) Up/){          $hosts_up = $1; }
   elsif($line =~ /(\d+) Pending/){     $hosts_pending = $1; }
   elsif($line =~ /(\d+) Critical/){    $services_critical = $1; }
   elsif($line =~ /(\d+) Warning/){     $services_warning = $1; }
   elsif($line =~ /(\d+) Unknown/){     $services_unknown = $1; }
   elsif($line =~ /(\d+) Ok/){          $services_ok = $1; }
   elsif($line =~ /(\d+) Pending/){     $services_pending = $1; }
}

# remove the username and password from the output
$nagios_host =~ s/.*\@//;

if($show eq "green" && ($hosts_down == 0 && $services_critical == 0
 ↪&& $services_warning == 0)){
   print "$nagios_host: OK";
}
elsif($show eq "red" && ($hosts_down > 0 || $services_critical > 0)){
   print "$nagios_host: ${hosts_down}D ${services_critical}C ";
}
elsif($show eq "yellow" && $services_warning > 0){
   print "$nagios_host: ${services_warning}W ";
}
elsif($show eq "all"){
   print "${hosts_down}D ${hosts_up}U ${services_critical}C
   ↪${services_warning}W ${services_ok}OK";
}
As you can see, I actually collect a lot more statistics than I ultimately use, just in case I want to refer to them later. The important thing to note in this script is that in each of the green, red and yellow statuses, I print something only if there's something of that status to print. This is crucial, because I don't want to clutter my hardstatus line, and I want to see yellow or red text only if it truly needs my attention.
Name this script nagios_scraper.pl, put it either in /usr/local/bin for everyone to use or your user's ~/bin/ directory, make sure it is executable, and then test it against your Nagios server to make sure you have the syntax right. For instance, if you had no user name or password set up for Nagios, and your Nagios server was named naggyhost, you would type the following command to test if everything was okay:
$ /usr/local/bin/nagios_scraper.pl naggyhost green
Type the following to test for critical alerts:
$ /usr/local/bin/nagios_scraper.pl naggyhost red
Or, type the following to test see all statuses:
$ /usr/local/bin/nagios_scraper.pl naggyhost all
I do recommend that you set up a user name and password for your Nagios Web access if you haven't already. Because the user name and password you use for this script ultimately will end up in plain text, I recommend setting up an account for the Nagios Web interface that can log in but can see only the Nagios status and can't submit any changes (like maintenance modes and acknowledgements). Let's assume I set up an account called readonly with a password of n0wr1t3 on naggyhost. I would call the script like this:
$ /usr/local/bin/nagios_scraper.pl readonly:n0wr1t3@naggyhost red
Again, if the script doesn't provide any output in one of the modes, it could just mean that the status doesn't currently apply. If you want to test that for sure, run the script with the all argument instead of green, yellow or red to see the full status.
We Will, We Will, Nag You
Once you have tested the script and have it working, the next step is to add it to your ~/.screenrc. The first step is to add three new backtick configuration lines to ~/.screenrc that will call nagios_scraper.pl each with green, red and yellow statuses. In my case, I assume you might have a few backtick commands defined, so I start with command 110:
backtick 110 27 27 /usr/local/bin/nagios_scraper.pl
 ↪readonly:n0wr1te@naggyhost red
backtick 111 61 61 /usr/local/bin/nagios_scraper.pl
 ↪readonly:n0wr1te@naggyhost yellow
backtick 112 73 73 /usr/local/bin/nagios_scraper.pl
 ↪readonly:n0wr1te@naggyhost green
I've set each of these commands to run at different intervals. I want to check for critical alerts more frequently than warnings or when everything is okay, so I run the command with the red argument every 27 seconds. I then run it with yellow and green every 61 and 73 seconds. Note that I set these intervals to be at odd times. I've realized the value in staggering my screen notification scripts so they don't risk all running at the same time, so to help with that I try to choose odd intervals.
Once you have defined the backtick lines, the next step is to add them to your hardstatus string so they show up in green, yellow and red. In my case I pasted in:
%{+b r}%110`%{+b y}%111`%{= g}%112`
so that my hardstatus string modified from my previous article would be:
hardstatus string '%{= w}%Y-%m-%d %c | %l | %101`|
 ↪%{+b r}%110`%{+b y}%111`%{= g}%112`'
Now save your changes to your ~/.screenrc, and either start up a new screen
session or type Ctrl-A : and type source ~/.screenrc to load these changes
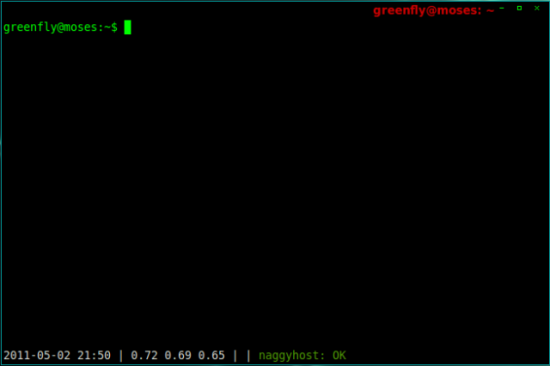
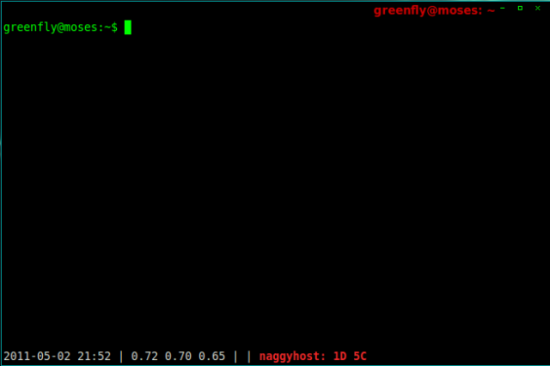
into your existing screen session. Figures 1 and 2 show
what the hardstatus line will look like either when the status is okay
or when there are critical alerts.

Figure 1. Everything is okay.

Figure 2. One host is down alert with five critical services.
What amazes me the most the more I dig in to screen notifications is just how simple it is to add new scripts to the list once you get the hang of it. Even if you don't use screen, it wouldn't be too difficult to modify the script so that it outputs to a desktop notification instead (see my December 2009 column for details).


