Mapping Your GIS Data
I've already looked at some GIS applications available on Linux. Programs like GRASS and qgis provide a full set of tools to do GIS. Sometimes, that's really overkill though. You may just want to display some data geographically and create a map. For those cases, there is Thuban, an interactive geographic data viewer.
Most distributions should have a package available within their package management systems. If not, you always can download the sources and build it from scratch. It does depend on Python, among several other libraries, so you need to do a bit of a dependency dance. Binary downloads even are available for Windows and Mac OS X, so you can point your non-Linux friends to them.
If you don't already have data of your own, sources of public-domain GIS data are available on-line. Here are a couple: https://www.naturalearthdata.com/features and https://wiki.openstreetmap.org/wiki/Shapefiles. The files available on these sites will get you started with SHP files that contain at least basic features for most of the world.
Thuban is not as flexible as full-fledged GIS software and cannot handle very many data file formats. You can use SHP files, DBF database files and various image file formats. In the screenshots for this article, I simply grabbed several of the data files available on-line.
When you start Thuban, you end up with a completely blank slate (Figure 1). The first step is to start a new session, which you can do by selecting the menu item File→New Session (not much will change on the screen). In order to start building your map, you need to add layers that can be manipulated. I started by selecting the menu item Map→Add Layer and adding in an SHP file to give me the basic geographic attributes for my home province of New Brunswick (Figure 2). This includes several different geographical items, such as water, river banks and parks. The default display is not very interesting yet (Figure 3).
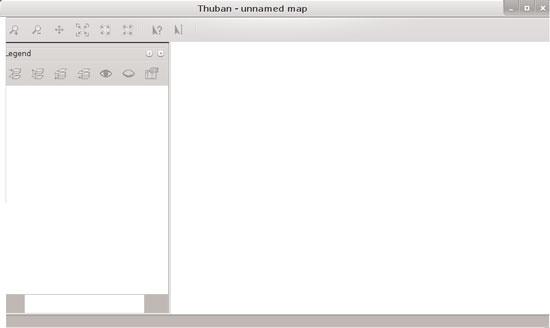
Figure 1. Starting Thuban gives you a blank slate.
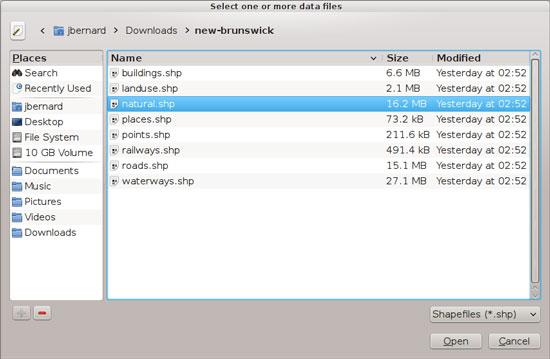
Figure 2. Adding a new layer opens a file selection dialog where you can choose an SHP file.
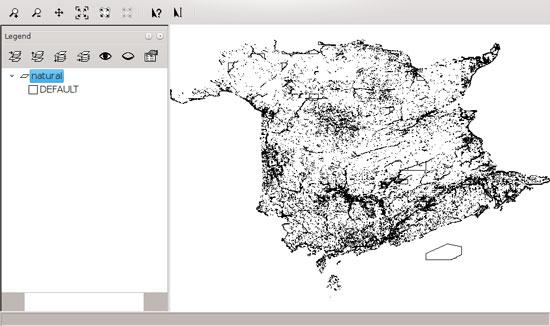
Figure 3. By default, Thuban just displays all of the data with a single symbol color.
You can edit the way a layer is displayed either by double-clicking the layer within the list in the legend pane or by right-clicking the layer of interest and selecting Properties. This will pop up a new window (Figure 4). In this case, I selected the "type" field within the classification pane. The easiest choice at this point is to click the Generate Class button. The Generate Classification window will pop up, where you can click on the Retrieve From Table button to get a list of the possible values. I accepted the default gray-scale mapping for the colors, giving four new entries in the layer properties. But this is not very interesting either, yet. Selecting each of the new properties, you can edit the symbol and change the colors for each of the types (Figure 5). If you want to have a preview of what this will look like, you can click the Try button. If it doesn't quite look right, you always can click the Revert button to undo the changes and try something else.
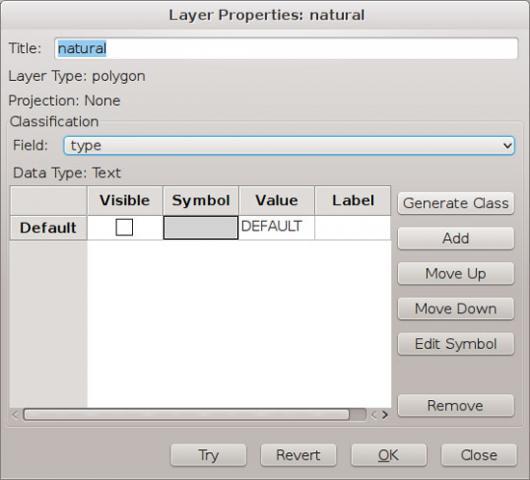
Figure 4. Each layer has a properties window where you can control how the data gets displayed.
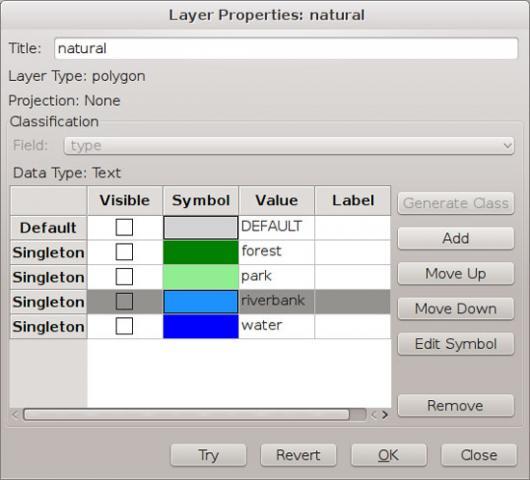
Figure 5. Using the Generate Class button is a shortcut to get you started.
Although every map begins with a single layer, it is very rare that a single layer is enough to show all the details you may want to have displayed. In this example, I don't have any roads on my map. A separate SHP file is available that has this information, however. So, I clicked on the menu item Map→Add Layer and added the file roads.shp. Opening up the properties dialog shows that this particular SHP file has several different attributes to play with. For now, I selected four different road types and highlighted them with four different colors. There is still a default color for any road types other than the four I selected. To make them go away on the map, you can select the default property and simply make it transparent. Then, only the four selected road types will show up. Now the map is starting to look a bit more interesting, and I need to start worrying about what order the layers are in.
Thuban will draw layers in the order they appear in the legend list, starting at the bottom and working its way up. You can move a particular layer up our down by selecting it and then using the buttons at the top of the legend pane.
Another type of layer you can use is an image layer. Obviously, the image needs to be geo-referenced in some way. Thuban supports the geoTIFF file format. If you place your image at the bottom of the layer list, you then can draw on top of it with the data in the SHP files.
To manipulate the map itself, Thuban uses a sort of mode system. To zoom in, you need to select the zoom button. Then, you either can use click and drag to select a region to zoom in on or simply click a spot on the map to re-center and zoom in. Once you have zoomed in, you can use the pan tool to move the view window around the map to highlight different regions. There are buttons to zoom you to specific scales such that the entire map is visible. This always takes you back to the default map view.
Two tools allow you to work with individual elements from an SHP file. The first is an information tool that pops up a detail window for any element you select. The second is a label tool. When you select an element, a dialog window pops up allowing you to select one of the properties to be displayed as a label.
Once you have a map you're happy with, you probably will want to save it for later use. Because Thuban works with sessions, all of your work in generating the map will be saved as a session within Thuban, as long as you remember to save it by clicking the menu item File→Save Session.
But, this doesn't help much if you want to use your map outside Thuban. There is an option to export a map as an SVG file by using the menu item Extensions→Write SVG Map. This is not the most efficient output available, however. My simple example here blew up to more than 50MB for a single map with two layers.
The other option is to print your map. Although you can print to actual paper, for a hard copy, you also can print to a file using the generic PostScript printer. This generates a PostScript file that will be a bit more manageable. You also can convert this PostScript file to other formats with relative ease. So, to get a PDF of your map, you can print to a PostScript file and then convert it to PDF with the ps2pdf utility. Now you have a map that you can share with friends and family.


