A Look at KDE's KAlgebra

Many of the programs I've covered in the past have have been desktop-environment-agnostic—all they required was some sort of graphical display running. This article looks at one of the programs available in the KDE desktop environment, KAlgebra.
You can use your distribution's package management system to install it, or you can use Discover, KDE's package manager. After it's installed, you can start it from the command line or the launch menu.
When you first start KAlgebra, you get a blank slate to start doing calculations.
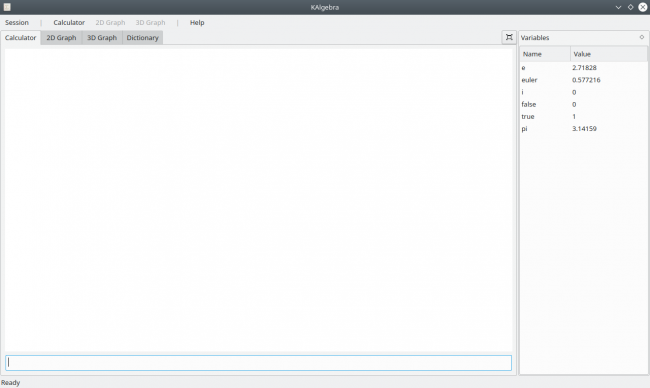
Figure 1. When you start KAlgebra, you get a blank canvas for doing calculations.
The screen layout is a large main pane where all of the calculations and their results are displayed. At the top of this pane are four tabs: Calculator, 2D Graph, 3D Graph and Dictionary. There's also a smaller pane on the right-hand side used for different purposes for each tab.
In the calculator tab, the side pane gives a list of variables, including predefined variables for things like pi or euler, available when you start your new session. You can add new variables with the following syntax:
a := 3
This creates a new variable named a with an initial value of
3. This new variable also will be visible in the list on the right-hand
side. Using these variables is as easy as executing them. For example,
you can double it with the following:
a * 2
There is a special variable called ans that you can use to get the
result from your most recent calculation. All of the standard mathematical
operators are available for doing calculations.
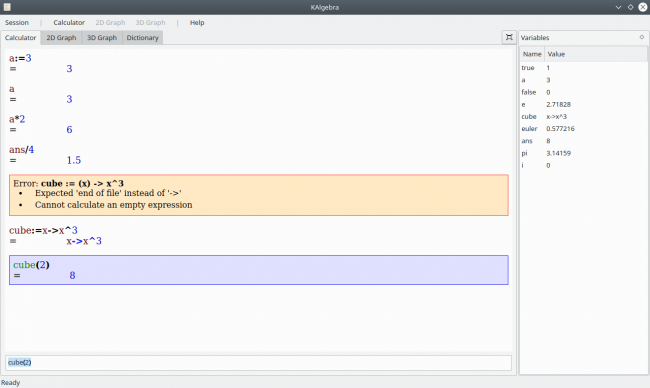
Figure 2. KAlgebra lets you create your own variables and functions for even more complex calculations.
There's also a complete set of functions for doing more complex calculations, such as trigonometric functions, mathematical functions like absolute value or floor, and even calculus functions like finding the derivative. For instance, the following lets you find the sine of 45 degrees:
sin(45)
You also can define your own functions using the
lambda operator ->. If you want to create a function that
calculates cubes, you could do this:
x -> x^3
This is pretty hard to use, so you may want to assign it to a variable name:
cube := x -> x^3
You then can use it just like any other function, and it also shows up in the list of variables on the right-hand side pane.
KAlgebra also has built-in graphing capabilities. Click the 2D Graph tab to bring up an empty graphing pane.
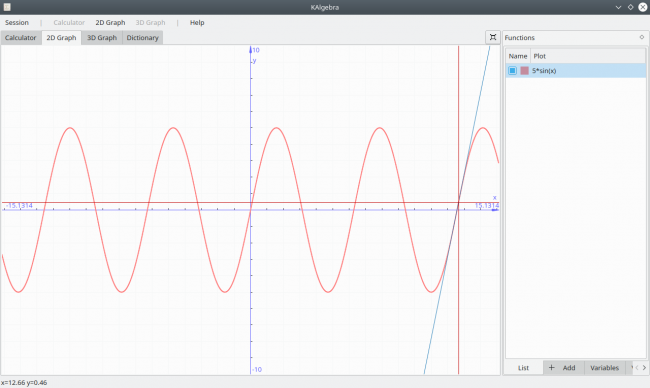
Figure 3. KAlgebra lets you plot multiple functions to make comparisons easier.
If you don't already have any functions defined, you will be given a pane on the right-hand side where you can add a new one. You can have several functions listed and select which ones you want to plot on the graph. The display includes two red lines that define the x and y coordinates, as well as a blue line that shows the slope of the function at the location of the cursor. If you right-click the graph, you'll see a drop-down menu with options like changing the graph's resolution or whether to display the grid. These options are also available from the 2D Graph menu item. Once you generate the plots you want, you can save the results either to an image file or an SVG file.
KAlgebra also has the capability for 3D graphing, which isn't as common. Click the 3D Graph tab to show a new graphing pane, which takes up the entire window.
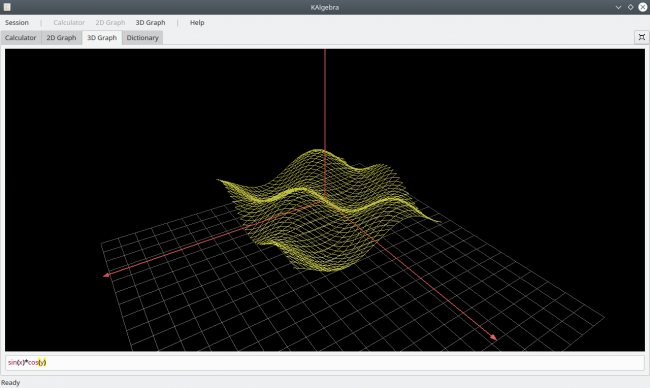
Figure 4. KAlgebra has the ability to do 3D plots of multivariate functions.
At the bottom of the pane, there is a text box where you can enter the function you want to plot. For example, the 3D plot you see here was generated with the following formula:
sin(x)*cos(y)
You can interact with the plot window with your mouse by grabbing and dragging the entire frame to get other views of the surface. You also can zoom in and out with your mouse. If you want to change how the function is actually displayed, click the 3D Graph menu item. Here, you can choose either dots, lines or a solid surface to show the results of the function of interest.
The last tab provides a dictionary of all of the functions available in KAlgebra. This lets you explore the provided functions to help you figure out what you might be able to use in your own calculations. There's an information pane that provides a description, a list of parameters and a number of examples. Below it is a plot window that graphs the given function, so you easily can visualize the behavior of the selected function. It's a handy way to select the base functions you want to use to build up more complex functions.
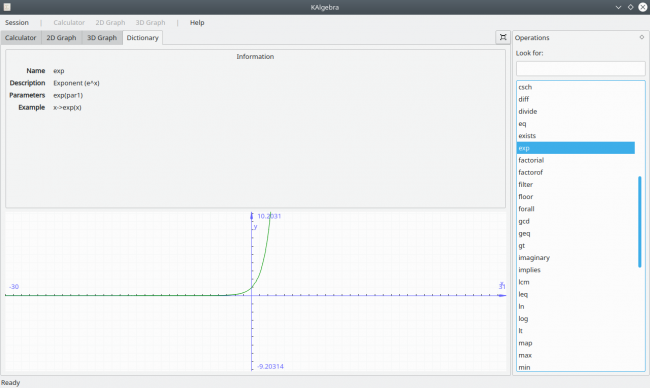
Figure 5. The dictionary tab provides detailed information on the built-in functions available in KAlgebra, along with a plot of the function.
Switching back to the Calculator tab, this activates the Calculator menu item. Under it, you can save and load script files. These files are simple text files, with the .kal file ending, that store the series of KAlgebra statements in your current session. You then can load this script again later to go back to your previous spot, or you can share the file with others.
For ideas on what you can do with KAlgebra, check out the handbook. This handbook also is available from KAlgebra's Help menu. For even more examples, see the KAlgebra section of the KDE UserBase Wiki.


